
Geography and map skills
Read contour lines on a map: height, slope, and valleys
Use the contour interval, line spacing, and height labels to turn a flat map into a careful explanation of the terrain.
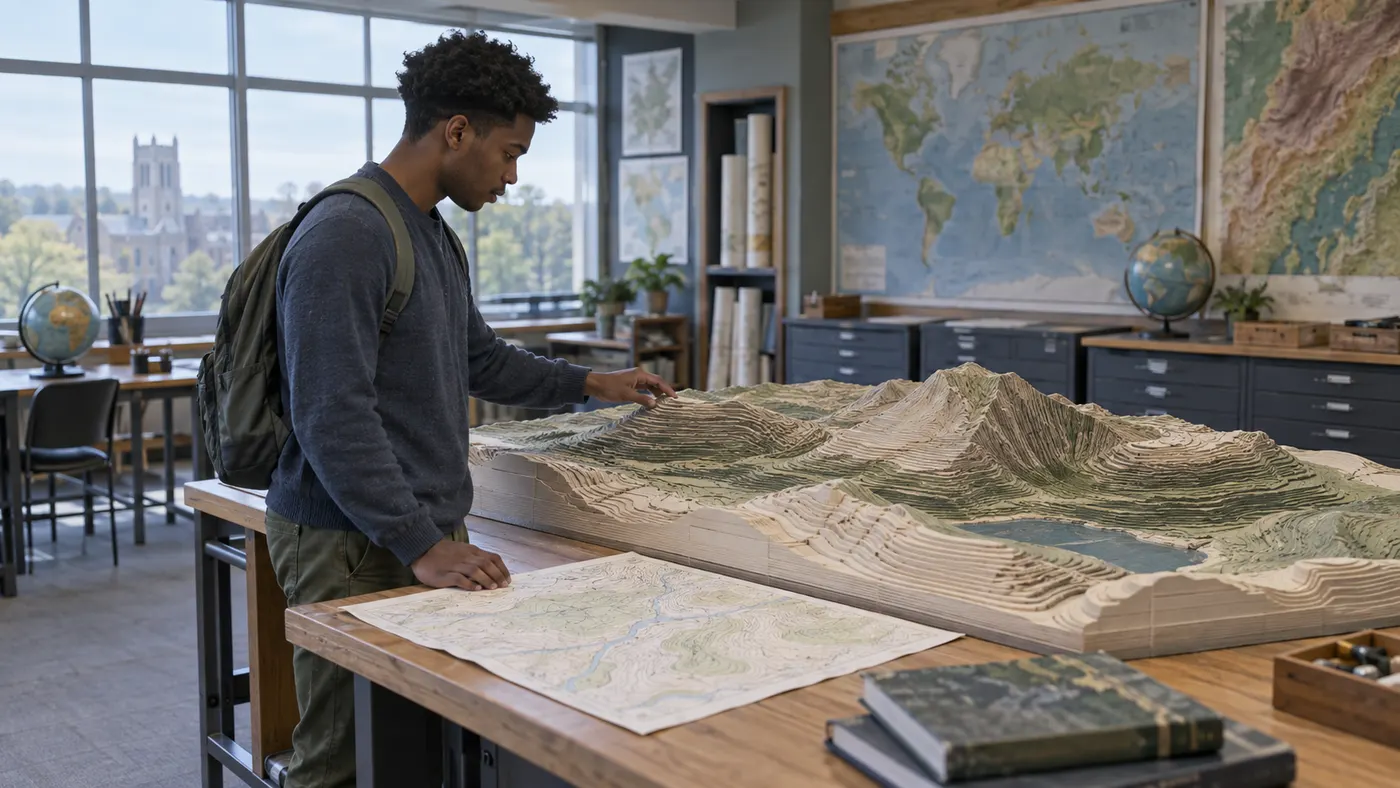
A topographic map can make a hillside look like a tangle of curves. In a geography question, you may need to decide which path climbs more sharply, estimate the height of a point, or explain whether a stream passes through a valley. Guessing from the brown pattern is risky. The map becomes readable when you find the contour interval, attach heights to neighbouring lines, and compare how much horizontal distance separates equal vertical steps.
This guide explains how to read contour lines on a map with paper, a pencil, and the map's own legend. A small invented example will carry the method from height to slope, valley, and cross-section. It is a practice model, not a claim about a real hiking route. Your teacher's map, legend, and conventions take priority, especially where a worksheet omits labels or uses a different interval.
1. Read the map question before reading the contour lines
Underline the action in the question. 'Find the elevation' asks for a height or bounded estimate. 'Compare the slopes' asks how rapidly height changes over ground distance. 'Describe the landform' asks for the pattern of a hill, valley, ridge, or depression. These are related but not interchangeable. A pair of close lines cannot by itself tell you the height of a summit, and a high point is not automatically the steepest place.
Locate the title, legend, scale, contour interval, and units on the map. Height may be in metres or feet; the horizontal scale may be a ratio or a bar. Write the units beside your answer before calculating. On a worksheet with a clipped map, check whether the interval is stated in the instructions. If it is absent, do not invent one. You can still compare line spacing, but not assign exact heights to every line.
Mark the exact points and route named in the task. A path that follows a contour stays near one height, whereas a path crossing several contours changes height. If the question compares two routes, trace both from the same start and end points before judging them. Otherwise a longer gentle route and a short steep route may be mistaken for the same kind of climb.

2. Turn the contour interval into actual heights
A contour joins places at the same elevation. The contour interval is the vertical height difference between successive ordinary lines. The US Geological Survey explanation of map and compass use notes that the interval is given in the map margin and can differ from map to map. Do not assume a familiar number such as ten metres just because another exercise used it. Read one numbered line and count outward one step at a time.
Suppose a teaching map labels one line 100 metres and gives an interval of 20 metres. Moving uphill across the next lines gives 120, 140, and 160 metres. Moving downhill gives 80 and 60 metres. Keep track of direction: the line labelled 120 does not become 80 because it curves around the page. Its elevation is constant along its entire course. A thicker index contour may be labelled for convenience, but thickness alone does not change the stated interval.
A point exactly on the 140-metre line has that mapped elevation under the map's convention. A point between 140 and 160 metres is bounded by those heights; the line pattern alone usually does not justify a precise value such as 153.4 metres. If the exercise requests an estimate, state that it is approximate and explain how you judged its position. A spot height printed beside a dot is a separate measurement, not another contour line.
3. Compare steep and gentle slopes with equal steps
Each neighbouring pair of contours represents the same vertical change on one map. If that change happens across a short horizontal distance, the slope is steep; if it takes more horizontal distance, the slope is gentler. Compare spacing measured roughly perpendicular to the lines, not along a winding contour. A tightly packed area may deserve careful interpretation if the print is blurred or several symbols overlap.
Imagine route A crosses four 20-metre intervals in a short straight segment, while route B crosses the same four intervals over a much longer segment. Both gain 80 metres; A has the greater average rise per unit of map distance. You cannot compare the slope of two different maps by line spacing alone when their scales or contour intervals differ. First convert horizontal distances to the same real-world units and check the vertical interval on each sheet.
For an average gradient, divide vertical rise by horizontal ground distance after converting both to the same unit. An 80-metre rise over 400 metres is 0.2, or 20 percent grade. The straight-line map distance is horizontal, not the distance walked along a winding trail. The calculation describes an average between chosen points; a short section may be steeper. In a simple classroom comparison, a clear verbal explanation may be enough without computing a percentage.
4. Work out uphill direction before naming a landform
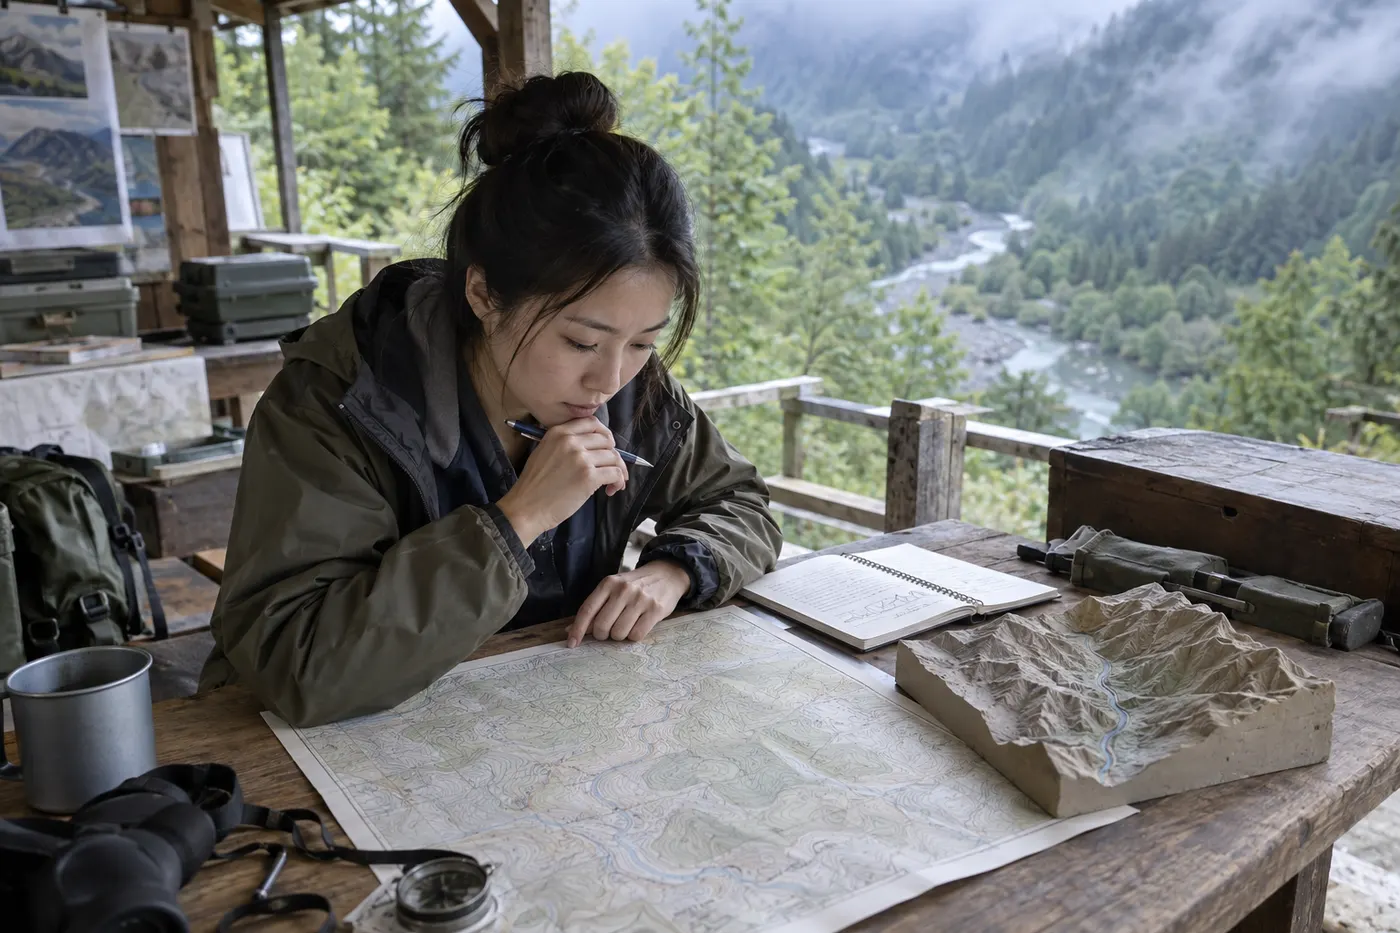
Follow numbered lines to decide which way the ground rises. Closed loops with increasing heights inward usually indicate a hill; decreasing labelled heights inward require another explanation such as a depression and its map symbol. A closed ring by itself is not proof of a summit. Check the legend for hachures or other depression marks, and compare nearby spot heights. If the crop hides all numbers, say which shapes you can observe and what cannot yet be determined.
A contour may bend into a V where it crosses a stream valley. On a conventional map, the point of that V generally points upstream toward higher ground, while water flows the other way. Test this with the numbered contours and any mapped stream rather than memorising the letter shape in isolation. A spur or ridge can also bend contours, but its projecting shape extends toward lower ground. Context and height labels distinguish the two.
5. Estimate a point's elevation without false precision
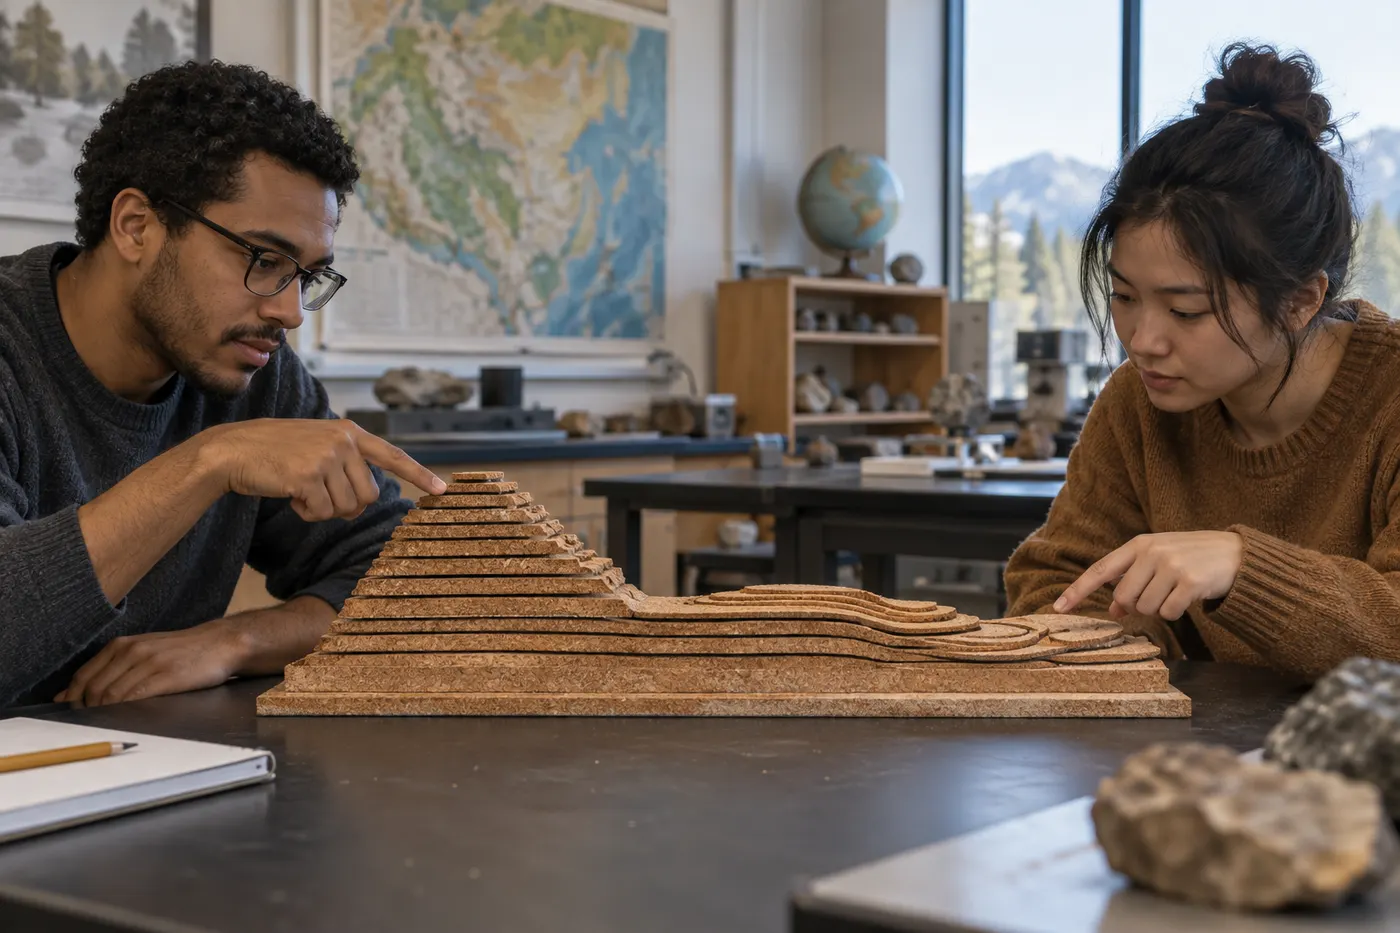
Suppose point P lies between the 120- and 140-metre contours on our invented map. Its elevation is higher than 120 and lower than 140 metres if no special contour or depression changes the interpretation. If P sits visually halfway between them, you might estimate about 130 metres, but that assumes the ground changes evenly across the gap. A contour map does not promise that. State the bracket first; add a rounded estimate only when the question calls for one.
When a hilltop sits inside the highest closed contour, the top is at least as high as that line but below the next hypothetical contour if the map would have shown it. With a 20-metre interval and a highest closed 160-metre contour, an unmarked summit could lie between 160 and less than 180 metres. A labelled spot height, for example 173 metres, supplies more precise information and should not be replaced by the midpoint of the contour band.
6. Draw a simple terrain profile from the map
A profile is a side view along a chosen line, such as A–B. Draw that line on a copy of the map or lay a paper strip over it. Tick every point where the line crosses a contour and note the contour's elevation. Keep the ticks in their original order. If the line runs along a contour for a distance, mark the start and end of that level stretch rather than counting it as repeated climbs.
Transfer the ticks to graph paper with horizontal positions preserved. Choose and label a vertical elevation scale, then plot each known height above its tick. Join points smoothly enough to suggest terrain without inventing sharp peaks between measurements. If A–B crosses 100, 120, 140, 120, and 100 metres, the profile rises and falls. It does not prove the exact summit height between the two 140 crossings unless a higher contour or spot height is shown.
Check your drawing against the original: the number of crossings, order of heights, direction of rise, and any repeated height should match. A profile can exaggerate vertical relief when its vertical and horizontal scales differ; that is useful for visibility but not a literal shape. Label both scales and avoid declaring one side 'more vertical' merely because the graph looks dramatic. For another kind of geography visual, compare the habit of checking axes in the climate-graph guide.
7. Practise with a complete invented map question
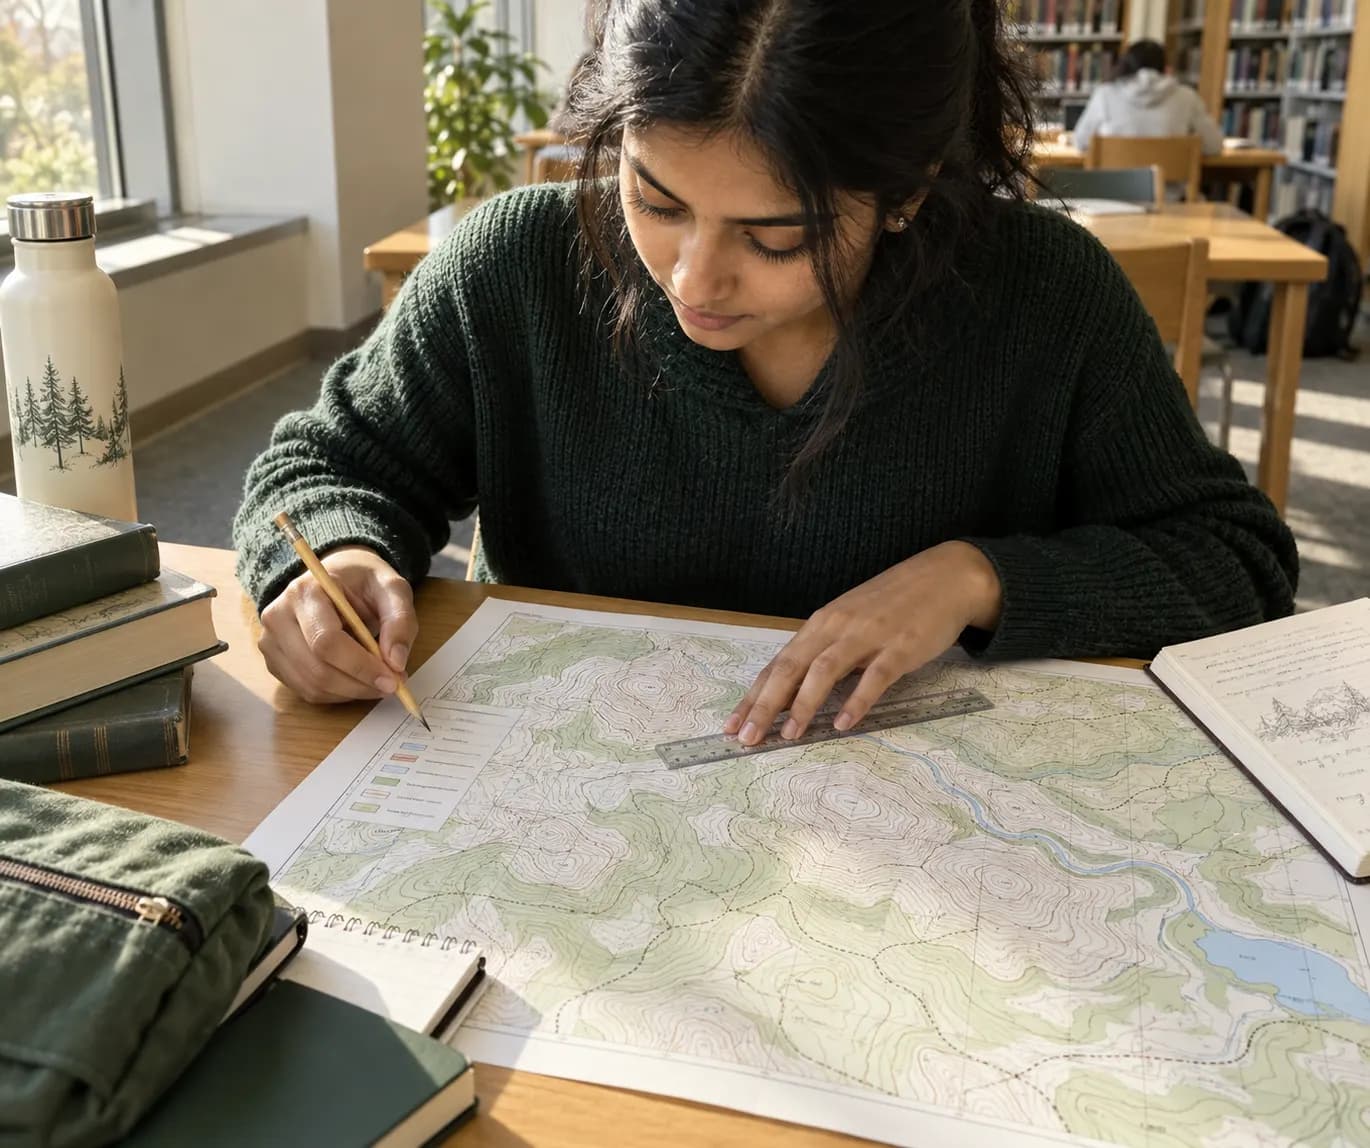
Take a map with a 20-metre interval. Along line A–B, you cross contours labelled or inferred as 80, 100, 120, 140, 120, and 100 metres. The gap between 120 and 140 on the west side is narrow, while the corresponding gap on the east side is wide. Before reading on, identify the highest crossed contour, the side with the sharper slope at that height step, and the broad shape of an A–B profile. Draw a small sketch instead of answering by impression.
The highest contour crossed is 140 metres. The west side is steeper over that particular 20-metre step because the lines are closer there, assuming one map scale throughout. The profile climbs from A, passes the 140-metre contour, then descends toward B. We still do not know the exact height between the two 140-metre encounters or the top beyond them. If the line crosses 140 only once because the map edge truncates the shape, revise the profile accordingly.
8. Check the limits of the map and any digital help
Maps are designed for particular scales, dates, and purposes. A small-scale classroom extract may omit minor gullies, recent paths, or hazards. It may also hide the map margin containing the interval. For a school answer, name any missing information rather than filling it in. For outdoor decisions, use a current suitable map and local safety advice; this article's invented examples are study exercises, not navigation directions.
You can practise the steps freely with a printed map and a paper strip. If you want another way to test yourself, turn your own checked observations into practice questions, or use a quiz from notes to ask which side is steeper and why. Lirno is free to download or start, while some AI usage levels or advanced features may require Premium. Neither an app nor a generated answer is necessary to complete the method above.
AI may misread tiny contour labels, confuse a ridge with a valley, or reason incorrectly about a cropped map. Compare any suggestion with the original legend, heights, and course examples. School rules still apply to assessed work. Lirno does not guarantee correctness, grades, mastery, or permission to use AI. A strong answer explains which specific map marks support the claim, so you can defend it without the tool open.
9. Turn the map into a concise explanation
For an elevation question, name the two bounding contours and their units before giving an estimate. For a slope question, name the equal vertical steps and compare their horizontal spacing on the same scale. For a valley question, show the height direction and the bend of the contours, then explain how the conclusion follows. This order produces a short answer with evidence instead of a list of memorised slogans.
Finally cover your annotations and repeat the reading on a new map. Find the interval, label three neighbouring lines, select a steep and a gentle section, and trace a short profile. If you hesitate, locate the first unsupported step rather than re-reading everything. That targeted correction is more useful than copying a finished diagram. A contour map is a model of terrain, and your task is to say both what it shows and where its detail ends.